ML
Overview
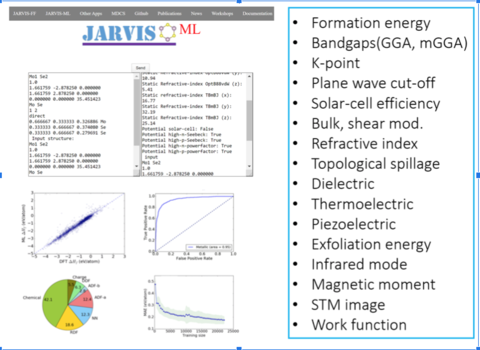
Currently, there are two types of data that are machine-learned (ML) in JARVIS-ML: discrete and image-based.
JARVIS-ML introduced Classical Force-field Inspired Descriptors (CFID) as a universal framework to represent a material’s chemistry-structure-charge related data. These descriptors along with powerful AI/ML algortihms such as neural networks, Gaussain processes and decision trees etc. provide a powerful tool for materials informatics. With the help of CFID and JARVIS-DFT data, several high-accuracy classifications and regression ML models were developed, with applications to fast materials-screening and energy-landscape mapping. Some of the trained property models include formation energies, exfoliation energies, bandgaps, magnetic moments, refractive index, dielectric, thermoelectric, and maximum piezoelectric and infrared modes. Also, several ML interpretability analysis revealed physical-insights beyond intuitive understandings in materials-science. These models, the workflow, dataset etc. are disseminated to enhance the transparency of the work. Recently, JARVIS-ML expanded to include STM-image ML models, as they are reported to directly accelerate experiments. Graph convolution neural network models are being developed for the image and crystal-structures. For image based convolution neural network based classification is carried out.
 .
.
Methodology
- Crystal structure specific information are converted into the Classical Force-field Inspred Descriptors (CFID).
- For each crystal (3D, 2D, 1D, 0D, molecule, proteins and surface) 1557 CFID descriptors are obtaines.
- The CFID consists of 1557 descriptors for each material: 438 average chemical, 4 simulation-box-size, 378 radial charge-distribution, 100 radial distribution, 179 angle-distribution up to first neighbor, and another 179 for the second neighbor, 179 dihedral angle up to fist neighbor and 100 nearest neighbor descriptors.
- We have converted at least 1 million atomic structures to CFID descriptors and that dataset will be made available soon. After generating the features, we trained several property models.
- JARVIS-ML model accuracy is evaluated on the test-set (usually 10 %) representing newly computed and previously unseen DFT data for both regression and classifications models. Accuracy of regression and classification models are reported in terms of mean absolute error (MAE) and Receiver Operating Characteristic (ROC) Area Under Curve (AUC) metric respectively.
# An example of JARVIS-ML training
from jarvis.ai.pkgs.utils import get_ml_data
from jarvis.ai.pkgs.utils import regr_scores
X,y,jid=get_ml_data()
#Formation energy for 3D materials, you can choose other properties/dataset as well
import lightgbm as lgb
from sklearn.model_selection import train_test_split
lgbm = lgb.LGBMRegressor(device= 'gpu',n_estimators= 1170,learning_rate= 0.15375236057119931,num_leaves= 273)
X_train, X_test, y_train, y_test, jid_train, jid_test = train_test_split(X, y, jid, random_state=1, test_size=.1)
lgbm.fit(X_train,y_train)
pred = lgbm.predict(X_test)
reg_sc = regr_scores(y_test, pred)
print (reg_sc['mae'])
Property details and assesment
Table. Performance of regression machine learning models in JARVIS-ML with JARVIS-DFT data using OptB88vdW (OPT) and TBmBJ (MBJ) with mean absolute error (MAE). The mean absolute deviation (MAD) of properties are also included.
| Property | Training data | MAE | MAD |
|---|---|---|---|
| Formation energy (eV/atom) | 24549 | 0.12 | 0.81 |
| OPT bandgap (eV) | 22404 | 0.32 | 1.05 |
| MBJ bandgap (eV) | 10499 | 0.44 | 1.60 |
| Bulk mod., Kv (GPa) | 10954 | 10.5 | 49.95 |
| Shear mod., Gv (GPa) | 10954 | 9.5 | 23.26 |
| Refr. Index(x) (OPT) | 12299 | 0.54 | 1.15 |
| Refr. Index(x) (MBJ) | 6628 | 0.45 | 1.03 |
| IR mode (OPT) (cm-1) | 3411 | 77.84 | 316.7 |
| Max. Born eff. charge (OPT)(e) | 3411 | 0.60 | 1.48 |
| Plane-wave cutoff (OPT)(eV) | 24549 | 85.0 | 370.6 |
| K-point length (OPT)(Å) | 24549 | 9.09 | 22.23 |
| 2D-Exfoliation energy(OPT) (eV/atom) | 616 | 37.3 | 46.09 |
Table. Performance of the classification machine learning models in JARVIS-ML with JARVIS-DFT data using OptB88vdW (OPT) and TBmBJ (MBJ) with Receiver Operating Characteristic (ROC) Area Under Curve (AUC) metric. Random guessing and perfect ROC AUC are 0.5 and 1 respectively.
| Property | Number of datapoints | ROC AUC |
|---|---|---|
| Metal/non-metal (OPT) | 24549 | 0.95 |
| Magnetic/Non-magnetic (OPT) | 24549 | 0.96 |
| High/low solar-cell efficiency (TBmBJ) | 5097 | 0.90 |
| High/low piezoelectric coeff | 3411 | 0.86 |
| High/low Dielectric | 3411 | 0.93 |
| High/low n-Seebeck coeff | 21899 | 0.95 |
| High/low n-power factor | 21899 | 0.80 |
| High/low p-Seebeck coeff | 21899 | 0.96 |
| High/low p-power factor | 21899 | 0.82 |
References
- Machine learning with force-field inspired descriptors for materials: fast screening and mapping energy landscape, Phys. Rev. Mat., 2, 083801 (2018).
- Materials Science in the AI age: high-throughput library generation, machine learning and a pathway from correlations to the underpinning physics, MRS Comm., 9, 821 (2019).
- Enhancing materials property prediction by leveraging computational and experimental data using deep transfer learning, Nat. Comm., 10, 5316 (2019).
- Convergence and machine learning predictions of Monkhorst-Pack k-points and plane-wave cut-off in high-throughput DFT calculations, Comp. Mat. Sci. 161, 300 (2019).
- Accelerated Discovery of Efficient Solar-cell Materials using Quantum and Machine-learning Methods, Chem. Mater., 31, 15, 5900 (2019).
- Data-driven Discovery of 3D and 2D Thermoelectric Materials, arXiv:1906.06024.
- High-throughput Density Functional Perturbation Theory and Machine Learning Predictions of Infrared, Piezoelectric and Dielectric Responses, npj Computational Materials, 6, 64 (2020).
- Density Functional Theory and Deep-learning to Accelerate Data Analytics in Scanning Tunneling Microscopy, arXiv:1912.09027.